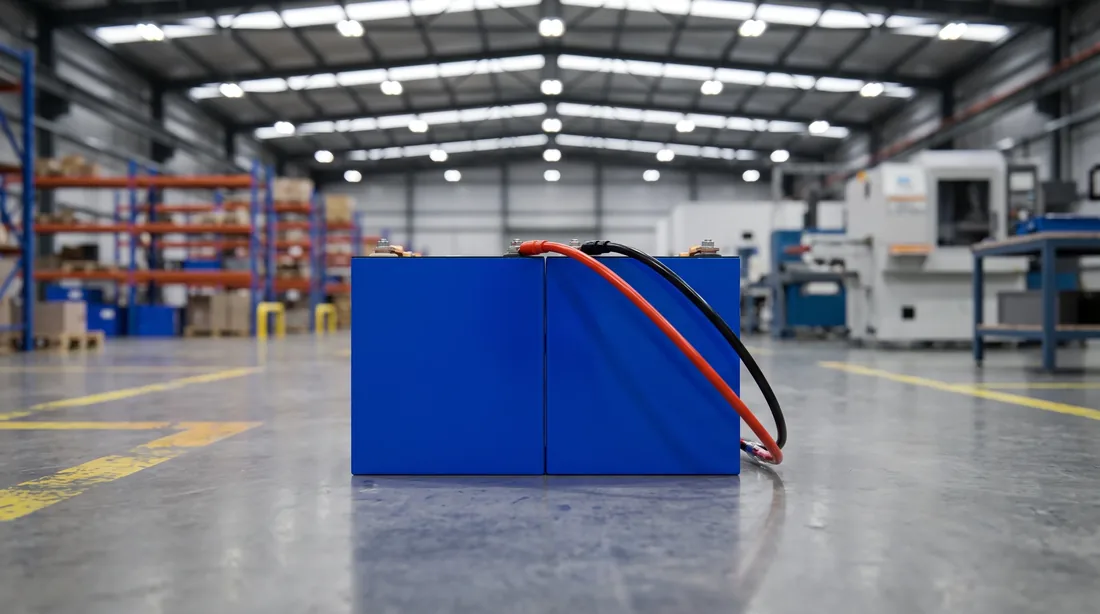
Capacity planning / three tiers, four figures each
Choosing Between Three Pack Line Tiers,
Including Where the Data Runs Out
Takt alone will not separate them — the first two tiers overlap on it. Footprint, installed power and how many positions are machines are what actually decide which one you are buying.
Read this before the table
- The first two ranges meet at 8 PPM
- That is not a typo and it is not a rounding
- It is why section 07 exists
- 4–8 PPMBLP-P8S — semi-automatic
- 8 PPMBLP-P8 — standard
- 12–15 PPMBLP-P15 — high automation
You have an output target, a building and a headcount budget. Two of the three are fixed.
Which tier fits is decided by all three together, and almost never by the output target alone.
The output was promised
The building is already standing
The headcount budget is the one people forget
The tier is the only variable left
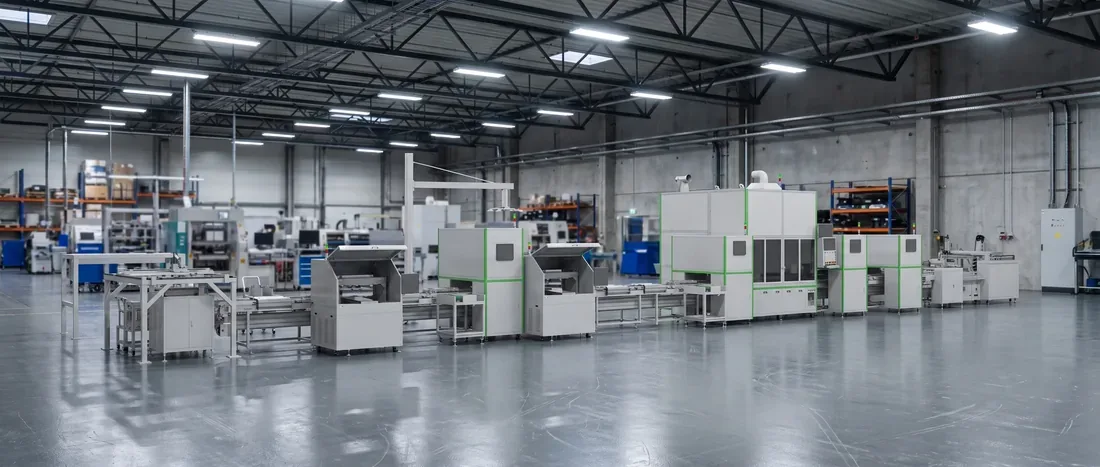
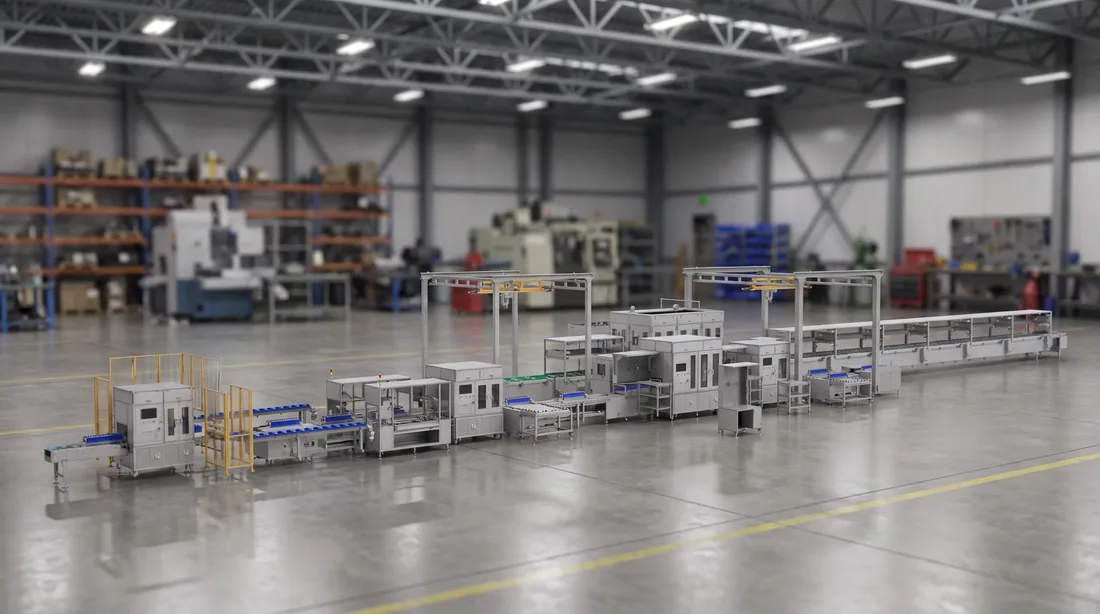
Every other page on this site gives you two of these figures at most. This is the page that gives you all of them at once, including the three places where the source data does not agree with itself.
Three ways a tier is chosen wrongly, and what each one costs afterwards
All three are decided in a week and paid for over a decade.
Chosen against the peak month
Chosen against today
Chosen on takt alone
The first two are forecasting problems, and you know your forecast better than we do. The third is a specification problem, and it is ours to fix — which is what section 05 and section 07 are for.
Two of these tiers publish takt figures that touch. The one that separates them is the building — and the building is the thing you cannot change afterwards.
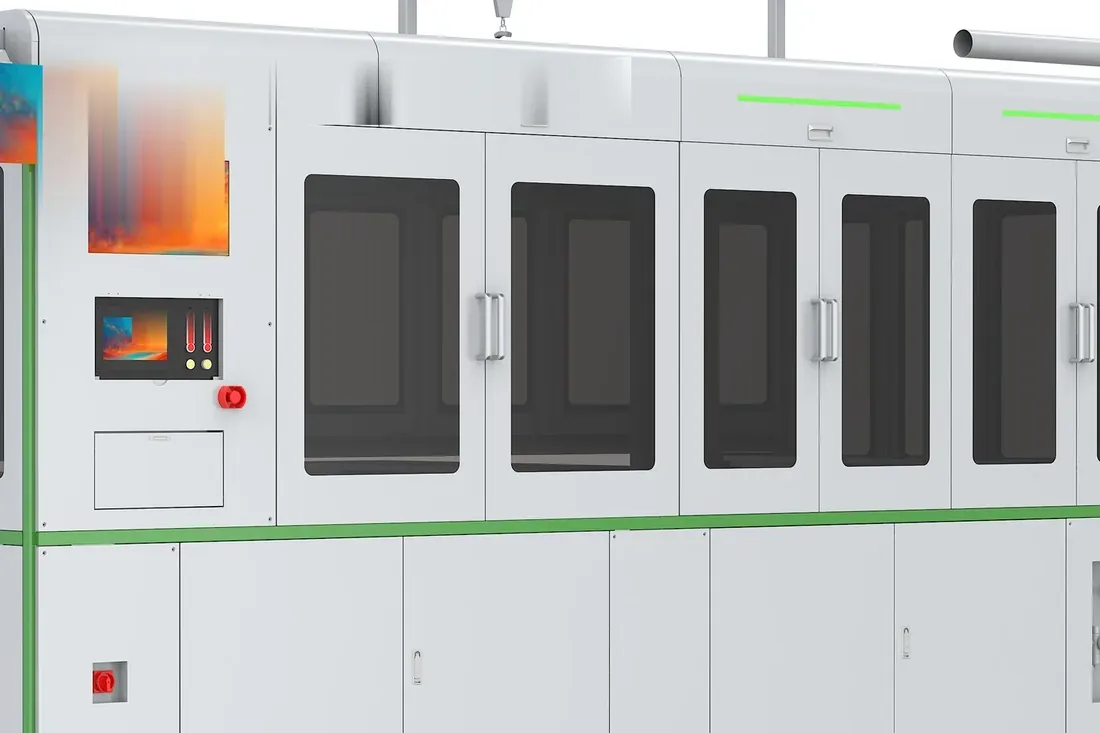
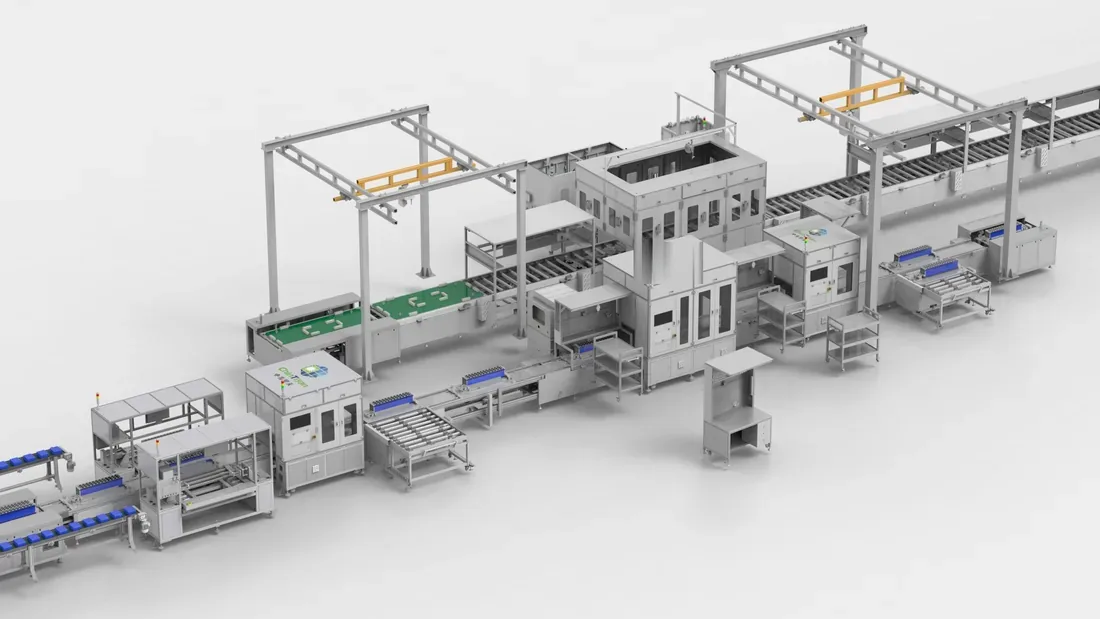
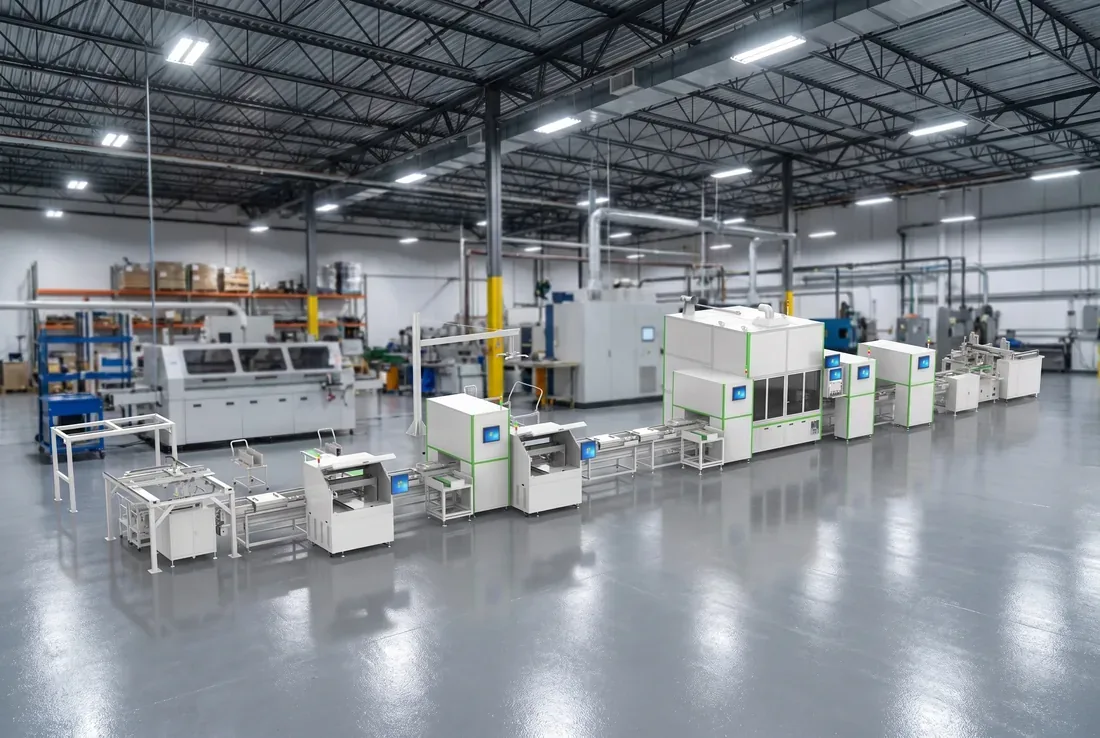
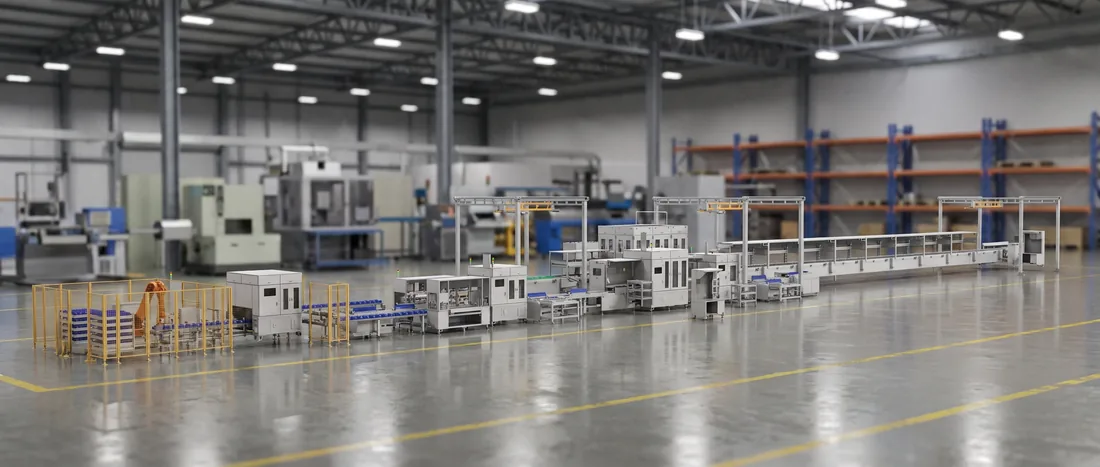
56 × 10 × 4 m — BLP-P8S
55 × 9 × 3.5 m — BLP-P8
54 × 20 × 4 m — BLP-P15
Three tiers, four figures each, and every gap named
⚠️ Four cells in this table carry a label instead of a number. None of them is blank — each label says which kind of absence it is.
| BLP-P8SSemi-automatic · economy | BLP-P8Standard | BLP-P15High automation | |
|---|---|---|---|
| Takt | 4–8 PPM | 8 PPM | 12–15 PPM |
| Footprint L × W × H | 56 × 10 × 4 m | 55 × 9 × 3.5 m | 54 × 20 × 4 m |
| Installed power | 200 kW | ≤250 kW | 300 kW |
| Annual output | 500 MWh – 1 GWh | Not in the source dataOn request, once the line is engineered | 1 – 2 GWh |
| Headcount — cell handling | 4 | Conflicting in the source data | 4 |
| Headcount — module welding | 4 | Conflicting in the source data | 3 |
| Headcount — pack assembly | 12–14 | Withheld with the rest of this row | 12–14 |
Three figures the source data does not settle, and what we do about each
The absence has a name in every case, and the name says which kind of absence it is.
| Figure | Kind of absence | What would resolve it |
|---|---|---|
| BLP-P8 annual output | Not in the source data | Published when the line is engineered against your cell and your shift pattern |
| BLP-P8 headcount | Conflicting in the source data | Two of the three cells disagree between internal documents. The third agrees, and is withheld with them so the row is read as one figure or not at all |
| BLP-P15 footprint | Two figures exist | Resolved already — we publish the layout-drawing figure and only that one |
A contradiction is not the same as a gap
The rule we apply is the same in all three
What this costs you: nothing you were going to get anyway
If a competing specification has a number in all of these places, that is worth a question rather than a point in its favour. Ask what it is based on, and ask it before the layout drawing rather than after.
Two tiers meet at 8 PPM, and takt is the one figure that will not separate them
This is the question the rest of the page is arranged around, so it gets the long answer rather than a footnote.
- Why this one
The two ranges touch, so the headline figure is the one they share.
BLP-P8S is quoted at 4–8 PPM. BLP-P8 is quoted at 8 PPM. A buyer comparing the two on rate is comparing them on the only figure they have in common — and every other figure in the table differs. Those others are the ones that decide what the line costs to own. - Without it
You take the cheaper build because the rate looks equivalent.
Then you inherit its consequences after the bay is committed: a different footprint, a different installed power, and a different number of positions that are machines rather than people. None of those is recoverable once the building is laid out around the line. - What it actually is
The economy tier is wider, longer and draws less power.
56 × 10 × 4 m against 55 × 9 × 3.5 m, and 200 kW against ≤250 kW. That combination is not an accident: fewer automated positions need more floor for people and less installed power for machines. The economy tier is not a smaller line — it is a bigger, quieter one. - What we do about it
We do not quote either of them as “an 8 PPM line”.
They are quoted as an economy build and a standard build, and the separation is published as footprint, installed power and automation level rather than described in adjectives. That is also why the takt row in section 05 is not the first row in the table. - What proves it
The table above: two tiers, one shared takt figure, four rows where they differ.
Take any tier comparison on your desk and check how many rows separate the tiers. If a specification separates its tiers only by rate, it has not told you what you are choosing between.
Station-level automation levels are published per station on the module and pack segment pages.
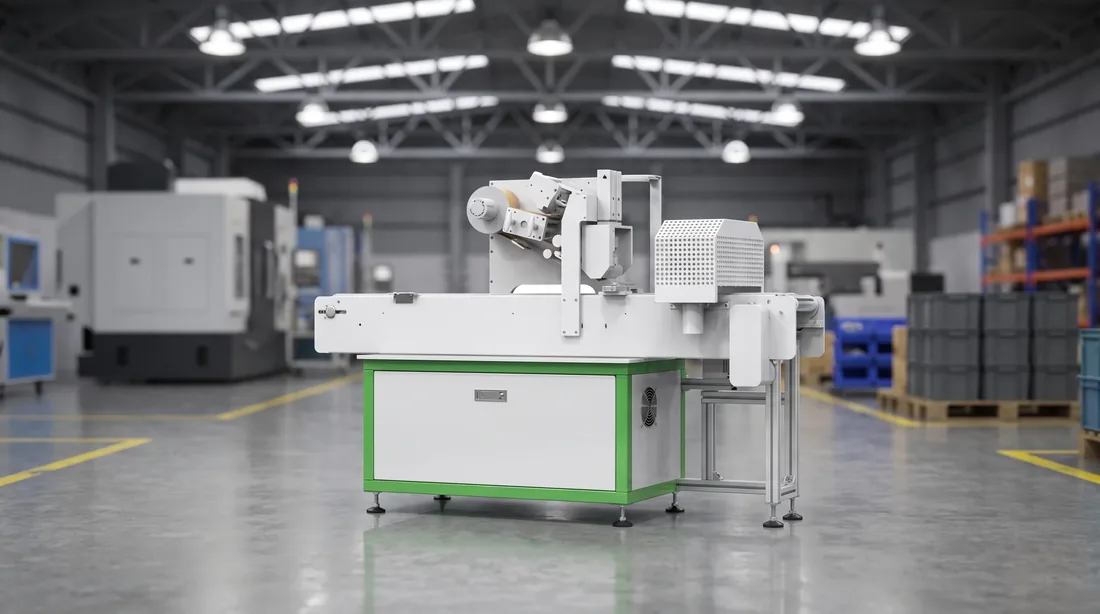
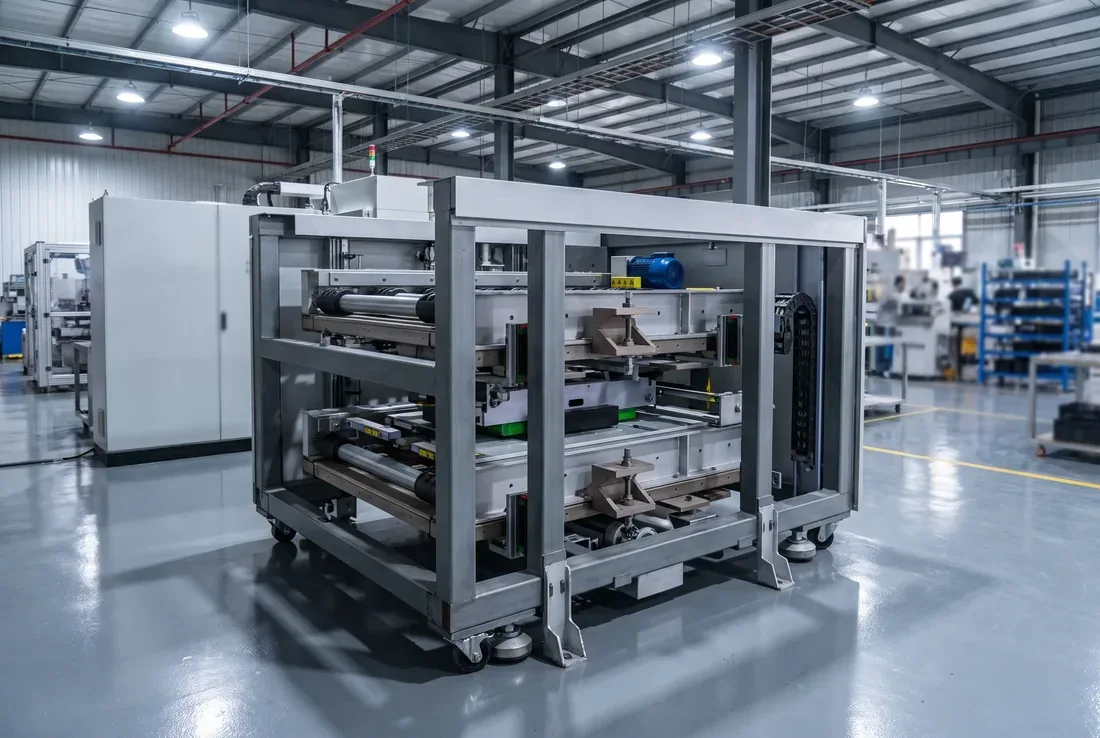
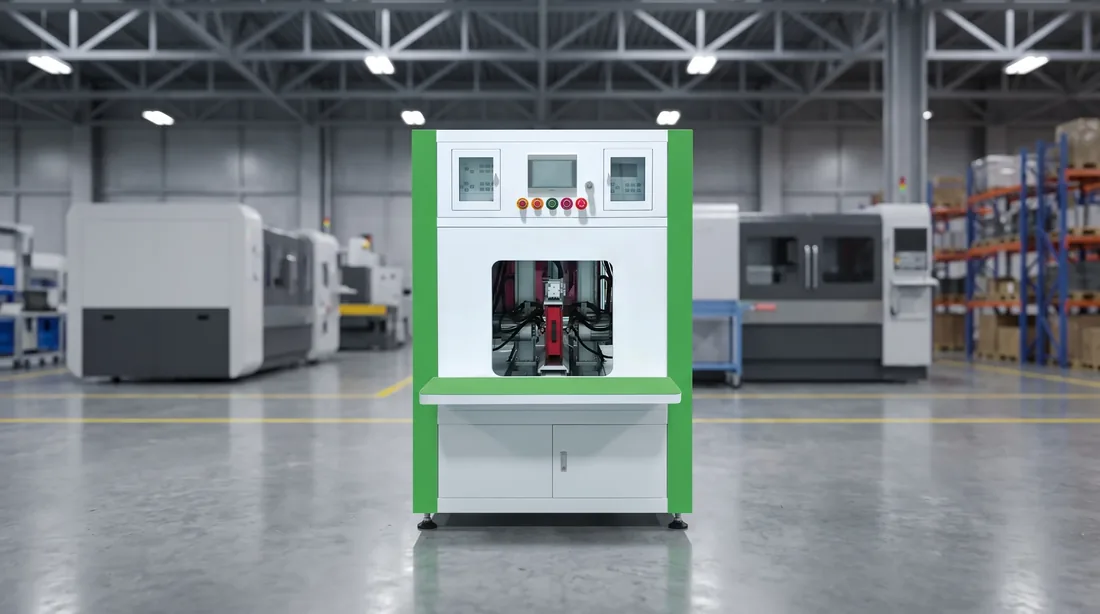
The fastest tier needs twice the width, and the slowest one is not the smallest
Footprint tracks automation level and people, not throughput. Reading it as a proxy for capacity gets the building wrong.
56, 55 and 54 metres — it barely moves
10, 9 and 20 metres — this is where they separate
4, 3.5 and 4 metres of clear height
Which is why the second question we ask is about the bay rather than about the output. A tier that does not fit is not a tier, regardless of what it would have produced. Layout is adjusted to the building you have — but adjustment works within a footprint, not against it.
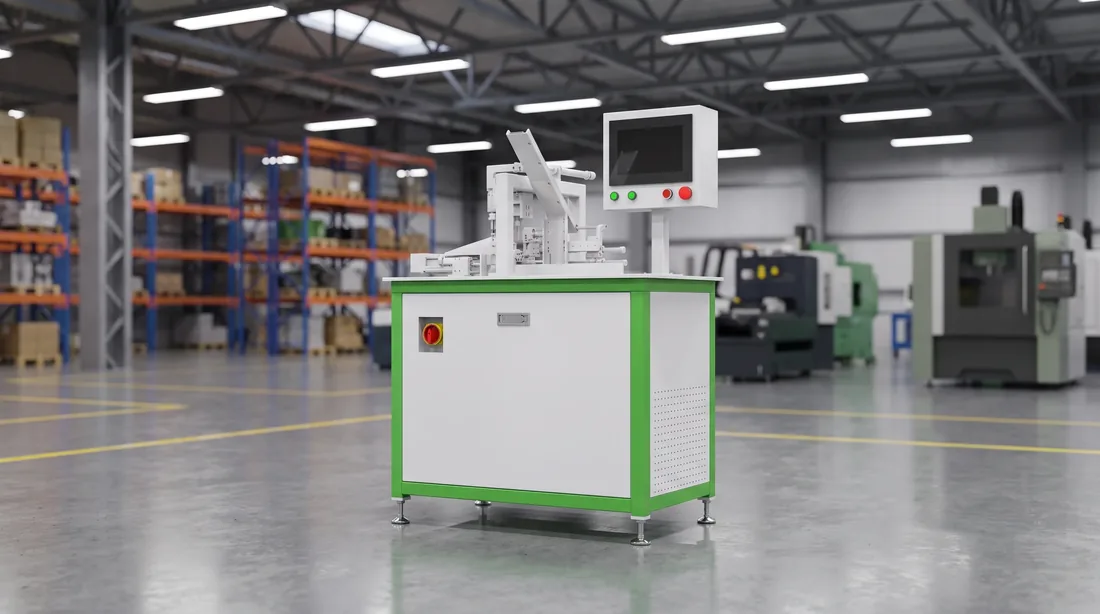
Automation buys one person in the module segment, not an empty floor
⚠️ This is the figure that repeats every year, and the two tiers we can publish differ by exactly one position.
The pack segment does not shrink
The module segment gives back one person
So headcount is not the reason to move up a tier
The station-by-station automation levels behind these figures are on the module segment and pack segment pages. ⚠️ BLP-P8 headcount is not published anywhere on this site, for the reason given in section 06.
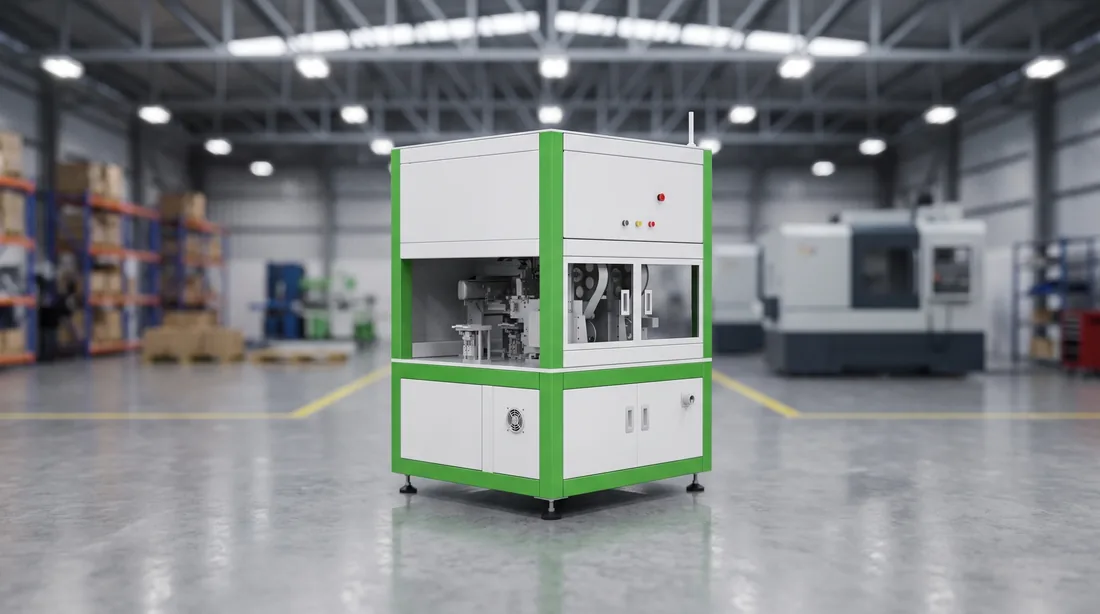
Three questions decide the tier, and you can answer all three today
None of them requires a drawing. They are the three inputs a tier recommendation is actually built from.
What annual output are you committed to?
What are the bay's clear dimensions?
What headcount can you sustain?
What comes back
If two tiers fit, we say so
If none fits, we say that too
Four things do not change with the tier
Which is worth knowing, because they are the things you would otherwise have to check three times.
Line acceptance yield — ≥99%
The footprint is adjustable to your building
Two segments, one takt
Utilities differ by tier, and are published separately
The definitions behind the yield figure — utilisation and first-pass yield — are stated once, on the home page. One definition, one place, three tiers that inherit it.
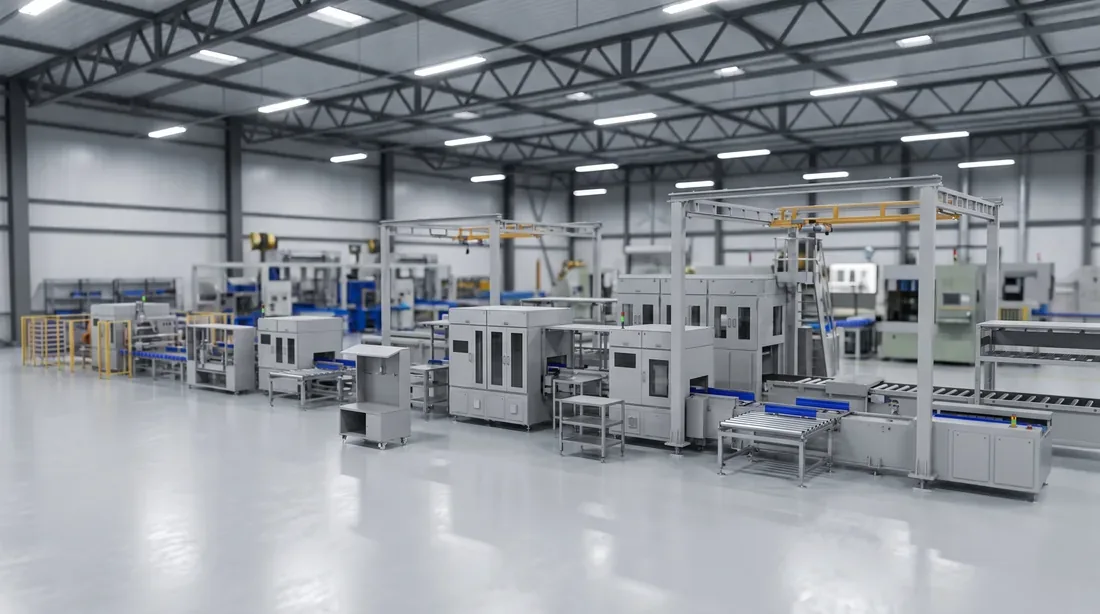
Send three numbers, get a tier with a reason attached
Annual output, bay dimensions with clear height, and the headcount you can sustain. Three lines of an email is enough to get a recommendation you can argue with.
Reply within 24 hours / If two tiers fit, we say so rather than pushing the larger one
We do not publish a payback period, and this is why
It is the figure a capacity-planning page is most expected to provide, and the one it is least able to.
It is made of your figures, not ours
A published figure would be about our assumptions
What we give instead
The same applies to labour savings expressed in money. We publish how many people staff each segment, on the tiers where the source data is consistent. What that is worth per year is arithmetic only you can do correctly.
Four questions that make two tier quotations comparable
Ask them of every quotation on your desk, including this one.
Does the specification separate its tiers by anything other than rate?
Is the footprint given as L × W × H, or as an area?
Is headcount published per segment, per tier?
Are there any gaps, and are they labelled?
We publish three tiers, four figures each, and three labelled gaps. The gaps are the part we would most like to remove and the part we are least willing to invent.
Where the stations, the thresholds and the blueprint are written up
- Cell handling
- Module segment
- Pack segment
- Tier selection — you are here
Run section 10 against your own figures first
All three questions there can be answered today, without a drawing.
Then send the answers rather than the question